Asia's response to the pandemic has rested largely on fiscal policy with monetary policy playing a facilitating role to varying degree. Fiscal policy is the subject of the second post in this series. The first post looks at factors influencing the impact of the pandemic on GDP growth, specifically, infection incidence, mobility loss due to transmission mitigation measures, and export decline.
|
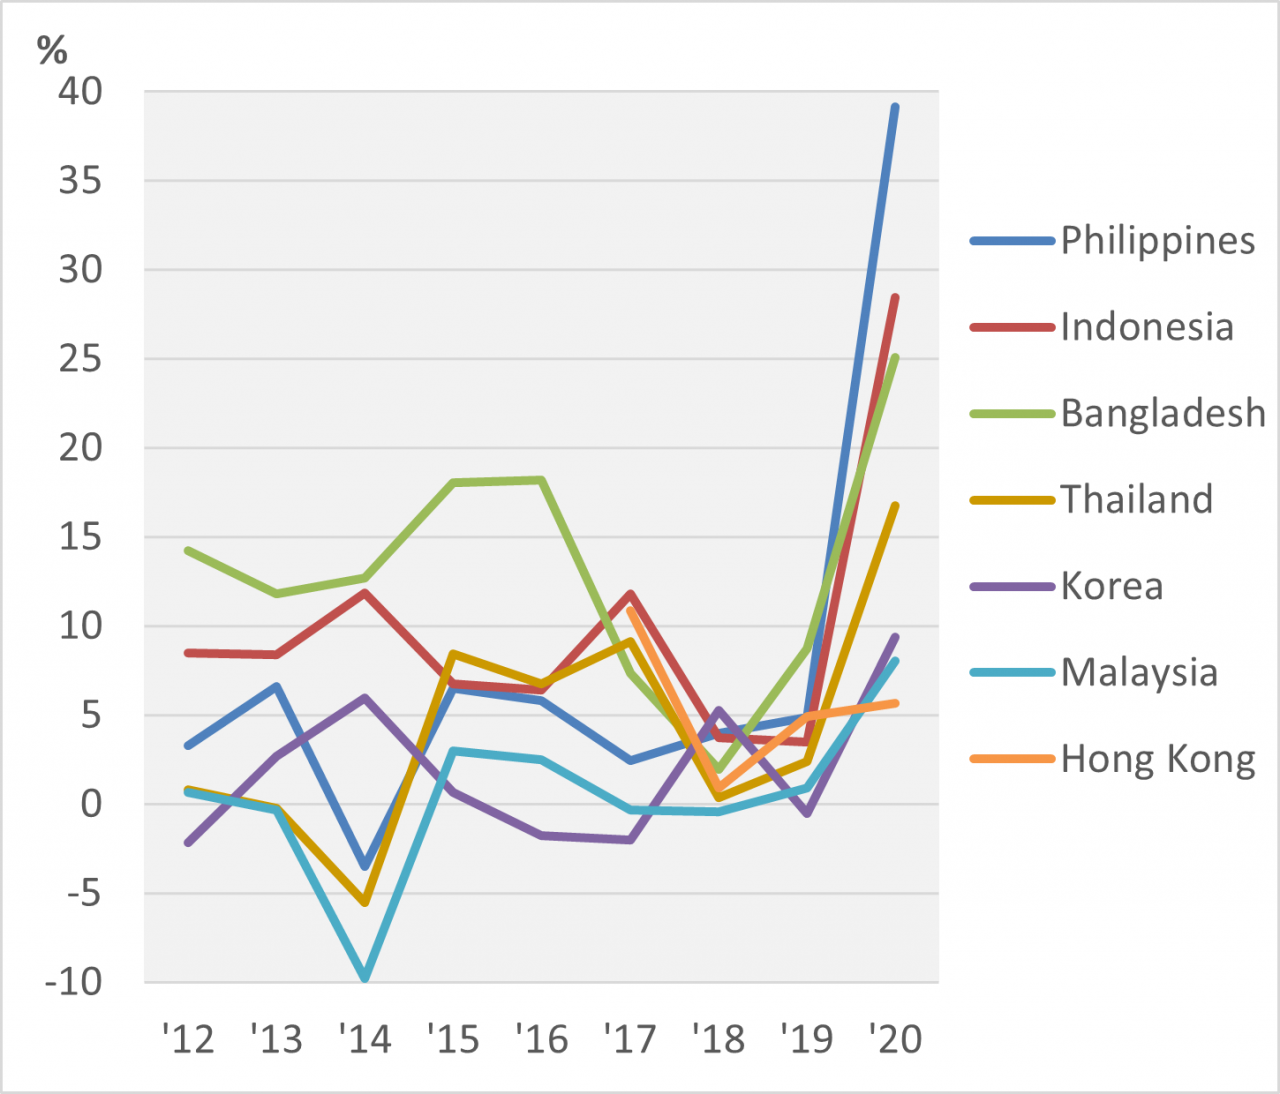
Chart 1: Central Bank Assets Growth Rate, 2020 Data source: IMF Monetary and Financial Statistics. |
In support of economic growth, Asian central banks eased in 2020 by lowering targets on policy interest rates and expanding asset purchases. This helped to absorb an increased issuance of government securities. A broad-based uptick in the growth rate of central bank assets in 2020 is visible in Chart 1. Prior to the pandemic, asset growth typically ran at less than 10 percent a year. In 2020, growth rates moved sharply above this threshold for the Philippines, Indonesia, and Bangladesh. In both the Philippines and Indonesia, central banks took the extraordinary step of lending directly to the government thereby relieving it having to sell securities on the open market with the central bank then making any purchases from the public. This ensured that the ramp-up in government borrowing did not stress the absorptive capacity of securities markets. For Bangladesh, the expansion in central bank assets traced to intervention in the foreign exchange market to absorb ballooning net inflows, most notably from increased worker remittances and foreign assistance receipts against a decline in import spending.
Whether such large increases in central bank assets will be inflationary will depend on whether the impetus feeds into bank lending to then fuel increases in aggregate demand. Economic uncertainty surrounding the pandemic tends to crimp such feed through. Banks prefer to build up safe holdings of reserves and government securities rather than lend in support of risky ventures, and businesses, too, are generally cautious about taking on capital projects.
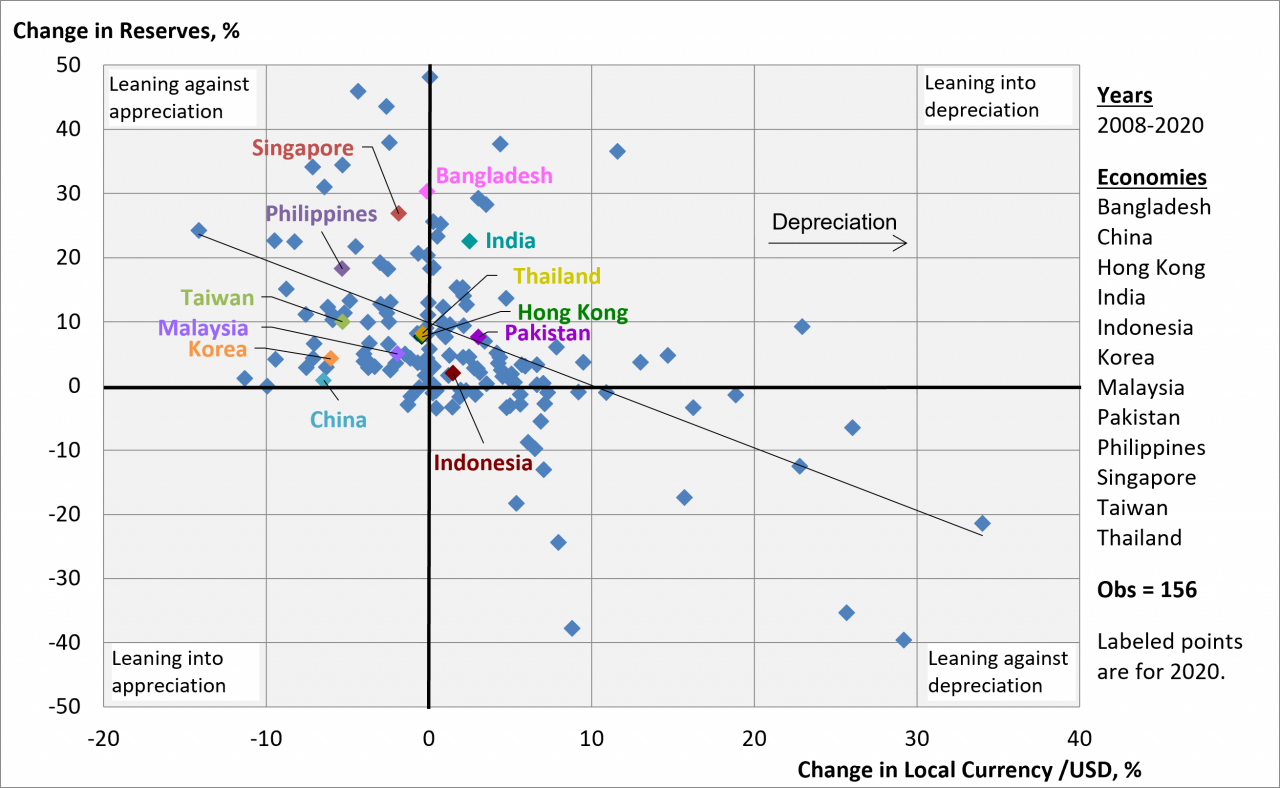
Thus far, indications are that investors remain confident in Asian currencies and satisfied with returns. Currency values have remained buoyant even as central banks intervened to sell domestic currency and accumulate foreign reserves, as shown by the concentration of values for 2020 in the upper left quadrant of Chart 2.* This quadrant represents central banks leaning against currency appreciation. Increases in reserve assets in 2020 were as high as 30 percent for Bangladesh and over 20 percent for Singapore and India. For India, Pakistan, and Indonesia, modest currency depreciation was leaned into by central banks. The positive balance of payments positions with currencies generally stable or appreciating despite mostly weakening exports suggest that holding onto global capital is not a worry. That has given authorities space to keep interest rates low in pursuit of accommodative monetary policy.
|
Chart 2: Official Reserves vs Exchange Rate, 2008-2020
Note: Change in reserves is measured as balance of payments flows relative to reserve stocks. Data Sources: Exchange rates, IMF International Financial Statistics; reserves, IMF Balance of Payments and International Investment Statistics and for Taiwan, Central Bank of the Republic of China. |
Global liquidity has been supported by expansionary monetary policy in the US as the pandemic raged. This has allowed Asian central banks to follow suit without concern for capital outflows. Should inflation pick up in the US, however, the situation could change. If the Fed were to tighten monetary policy in response, rising interest rates in the US would draw global capital in that direction putting pressure on Asian central banks to tighten as well. This possibility is the subject of a previous post by Jerry Schiff who considers the consequences in light of the Taper Tantrum of 2013.
The race is on, then, to move forward jointly in vaccinating populations and in order to pull out of the crisis together with normalization of macro policies in sync.
_______________________
*The analytical framework of Chart 2 was developed in a previous post on monetary policy and exchange rates.
This post is adapted from Chapter 15 of Macroeconomics for Emerging East Asia (Cambridge University Press, 2022; RePEc).
See also:
Economics of the Pandemic, 2020 (Part I): Covid Cases, Mobility Loss, and Exports
Economics of the Pandemic, 2020 (Part II): Fiscal Policy

