Why have the economies of Asia fared so differently under the pandemic? In 2020, the economy of the Philippines contracted by 9.5 percent and that of India by 8.0 percent. Meanwhile, Bangladesh achieved growth of 3.8 percent, Taiwan 3.1 percent, Vietnam 2.9 percent, and China 2.3 percent.
This post looks at three channels through which the pandemic impacted economic activity: infection incidence; mobility loss due to transmission mitigation measures; and export decline. Subsequent posts consider fiscal and monetary policy responses.
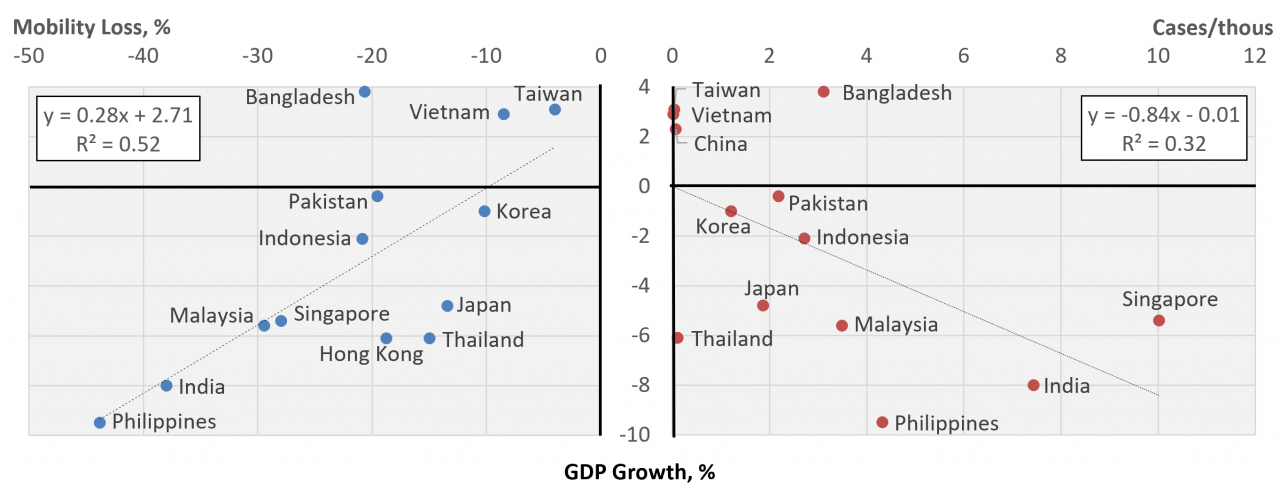
Chart 1 captures the impact of the first two impact channels on GDP growth for 2020. In the right panel, a number of economies (Taiwan, Vietnam, China, Thailand) are lined up at near-zero incidence of infection while the rest fan out as high as Singapore’s 10 cases per thousand. Despite being the source of the outbreak, China succeeded in simultaneously keeping case incidence low and achieving positive GDP growth. The same goes for Vietnam. In an article in Foreign Policy, Hayton and Ngheo attribute this success to a repressive party-state apparatus, organized down to neighborhood level, that was quickly directed toward contact tracing and containment. Taiwan, though lacking such authoritarian mechanisms, also managed to keep incidence in check and GDP growth positive, in its case by imposing a tight quarantine on entrants from abroad. At the opposite end of the spectrum, Singapore showed both high infection incidence (concentrated among expat workers living in dormitories) and substantial economic contraction. Yet overall, the correlation is weak with Thailand having low incidence while still suffering serious economic setback, and the Philippines, too, being hit far harder economically than its infection incidence would seem to warrant. Bangladesh, on the other hand, performed well economically despite moderately high incidence. The R2 from regression of GDP growth on infection incidence is just 0.32.*
|
Chart 1: Mobility Loss & Covid Cases vs GDP Growth, 2020
Data sources: Covid cases, Our World in Data; mobility loss based on "retail and recreation" and "workplaces" indicators, Google; GDP growth, IMF World Economic Outlook. |
The left panel of Chart 1 looks at the relationship between mobility loss and GDP growth. Mobility loss is more closely associated with poor GDP performance, the R2 taking a value of 0.52. Such a definitive negative effect on output is not a foregone conclusion. While the direct effect of mobility restrictions on GDP growth is clearly negative, the intended purpose is to reduce infection incidence which should be positive for GDP growth. Comparison across the two graphs, however, reveals that countries with the heaviest mobility loss also had the highest infection incidence – specifically, the Philippines, India, Malaysia, and Singapore. This could mean that severe mobility constraints were prompted by the spread of the virus having already reached high levels. Or, it could mean that even if constraints were implemented preemptively, the measures were not very effective in controlling transmission even as they impinged seriously on economic activity.
As the country with both the greatest mobility loss and the most severe GDP contraction, and moreover, the third highest infection incidence, the Philippines offers a case in point. Among the restrictions on mobility was a ban on riding double on motorcycles. With helmets on and cruising through open air, the risk of disease transmission while traveling by motorcycle would seem slight even as this mode of transport is vital in the Philippines for getting people to work and running errands. Another restriction involved reducing hours of operation for essential businesses such as supermarkets and pharmacies which meant that shoppers had to concentrate more densely during shorter time intervals. This may have had the perverse effect of increasing virus transmission even as it reduced economic activity. As one more example, bans on the sale of alcoholic beverages clearly hurt manufacturers and vendors of this product with dubious impact on virus transmission. In fairness, the Philippines did not have at its disposal the surveillance and control mechanisms of a repressive state and society. It is, rather, a very freewheeling kind of place. And perhaps restrictions that on the surface would not seem to mitigate virus transmission were nevertheless meant to send a message to nudge behavior toward social distancing. Whether a more carefully designed mitigation strategy would have been less devastating economically remains an open question.
|
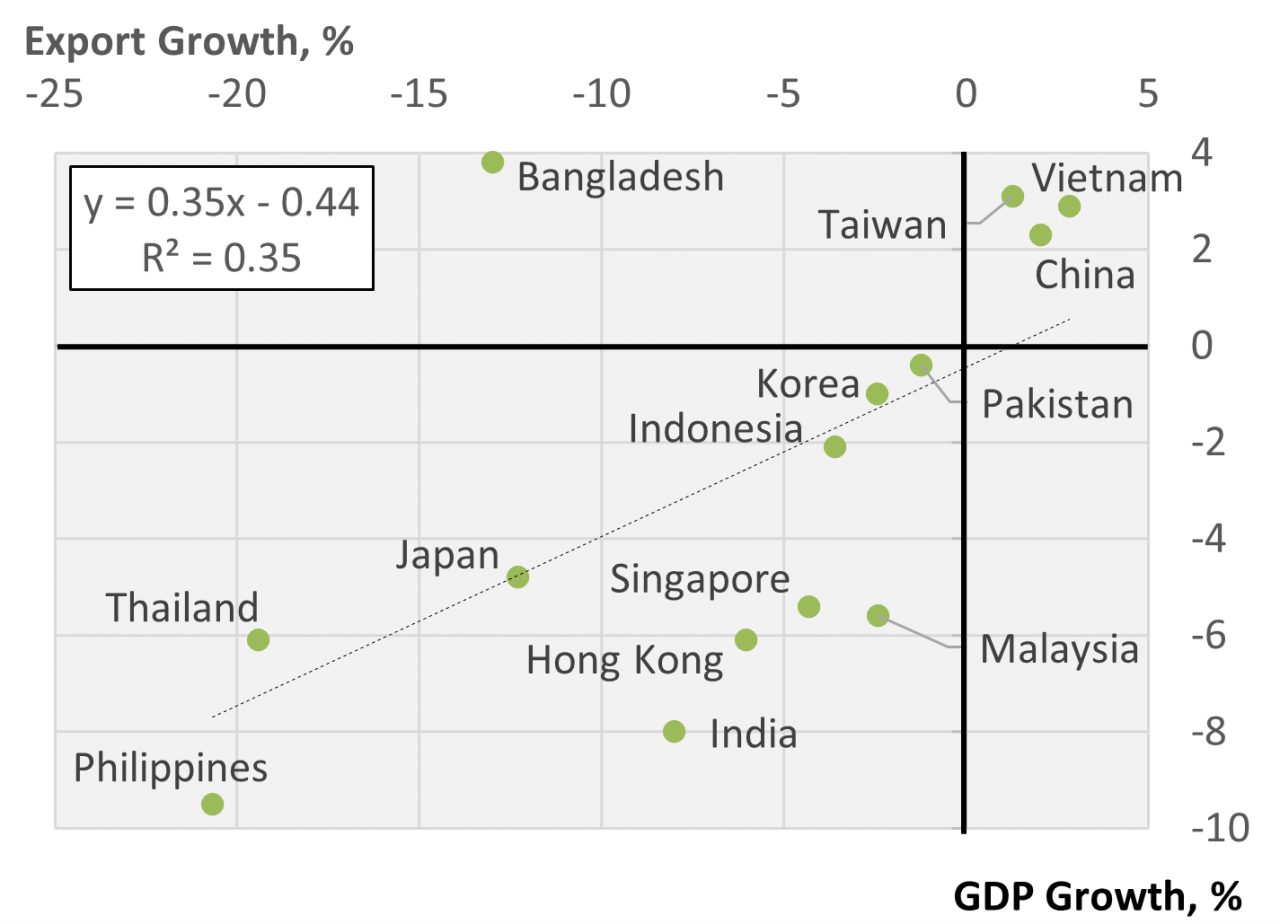
Chart 2: Export Growth vs GDP Growth, 2020
Data source: IMF World Economic Outlook. |
A final channel through which the pandemic hit with divergent effect across economies involves exports of goods and services, as illustrated in Chart 2. China and Vietnam again fared well, their export growth remaining positive as manufacturing capacity was quickly redirected to meet exploding demand for such items as personal protective equipment and electronic gear. And again, the Philippines was hit especially hard, as was Thailand, with both exposed to heavy losses in services exports, although details differ between the two. The Philippines has a large and diverse services export sector, which contributed 44 percent to total exports in 2019 (vs just 18 percent for the 14 economies in the aggregate), that took the hit broadly. Thailand’s services exports accounted for a smaller share of the total at 25 percent but with these exports concentrated in tourism where losses were especially serious.
Bangladesh is an outlier to advantage for all three relationships. It showed the best economic performance of the lot despite being harder hit than most through all three impact channels.
Differences in economic outcomes have further been shaped by differences in the conduct of macro policy where authorities must operate subject to differing constraints. Two follow-up posts look at fiscal and monetary policy with attention to policy space.
_______________________
*A post by Danny Quah argues that the relationship between Covid-19 and economic performance is nonlinear.
This post is adapted from Chapter 15 of Macroeconomics for Emerging East Asia (Cambridge University Press, 2022; RePEc).
See also:
Economics of the Pandemic, 2020 (Part II): Fiscal Policy
Economics of the Pandemic, 2020 (Part III): Monetary Policy
When you subscribe to the blog, we will send you an e-mail when there are new updates on the site so you wouldn't miss them.
Subscribe via ![]() in the tool bar.
in the tool bar.
Follow us on social media.
![]()
![]()
![]()