Against the blow of the pandemic, governments worldwide undertook expansionary monetary and fiscal policies. But by 2022, pressure was on to retrench as inflation reared up and government debt-to-GDP ratios mounted.
This post continues a series that applies the framework developed in Macroeconomics for Emerging East Asia (Cambridge University Press, 2022; RePEc) to analyzing monetary and fiscal policy. The series began with a trilogy of posts on the pandemic shock of 2020 and associated fiscal and monetary policy responses. There followed a post for 2021 in which the pandemic continued to figure as the main challenge to macro stability. This post for 2022 finds the pandemic subsiding with attention turning to the disruptive spillover of US monetary tightening and the need to re-establish fiscal sustainability.
Monetary policy action on the part of the US holds sway over policy space for the rest of the world. In March of 2020, the US Federal Reserve lowered the upper bound on the federal funds rate from 1.75 percent to 0.25 percent (FRED Economic Data). This undercut the dollar's attractiveness to buoy Asian currencies affording space for the region's central banks to follow the US with monetary stimulus. As shown in previous posts, Asian currencies generally appreciated in 2020 even as central banks leaned against appreciation by acquiring foreign reserves. Through 2021, the federal funds rate stayed at the lower bound but Asian currencies were no longer so well supported as they had been. Many depreciated, albeit with central banks leaning into that depreciation by continuing to acquire reserves. This ongoing expansionary impetus to central bank balances sheets preserved space for stimulus.
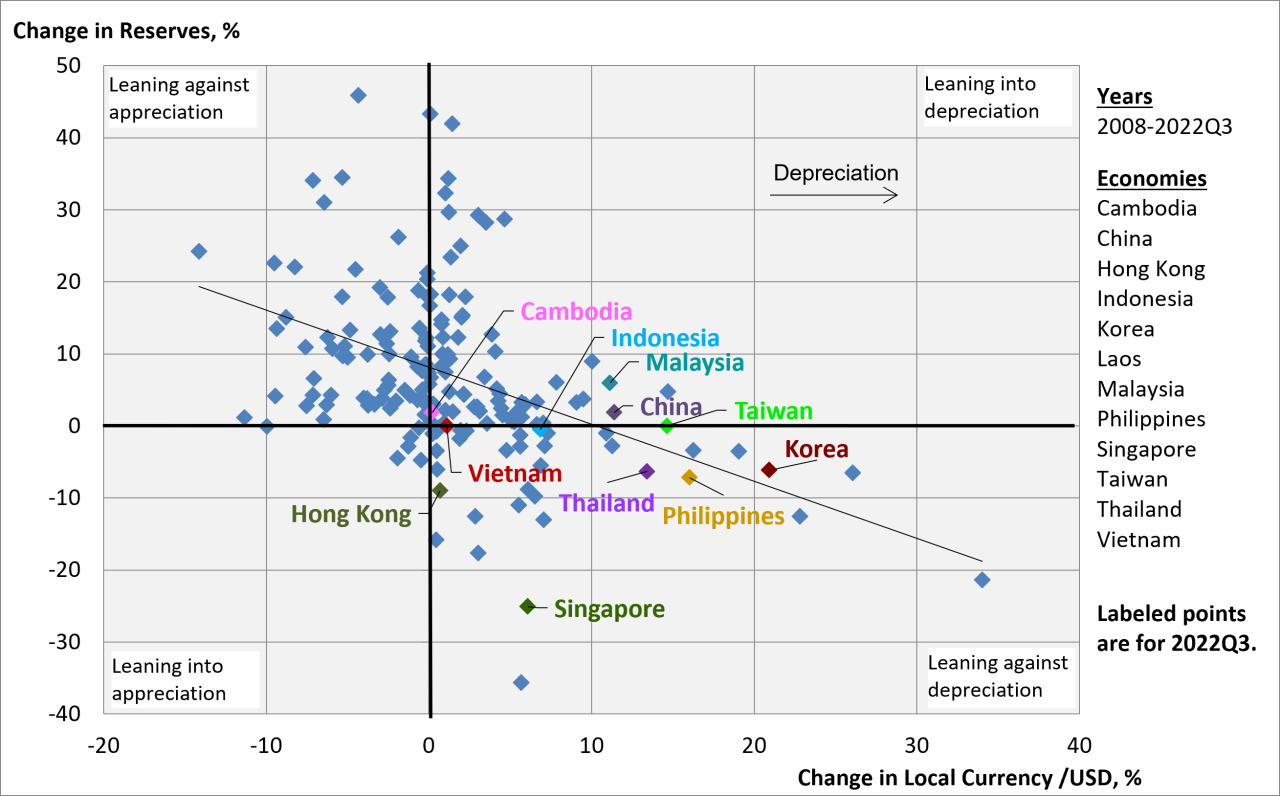
In 2022, the Fed pivoted sharply. To fight inflation, it set upon a course of raising the federal funds rate that by the end of the third quarter brought the upper bound to 3.25 percent. This favored the dollar, putting downward pressure on Asian currencies to the point that many central banks in the region sold off reserves to defend against currency depreciation. Within the framework of Chart 1 (applied previously in this series of posts), the mass of the distribution moved to the lower right quadrant in 2022 from its hold in the upper right quadrant in 2021 and before that the upper left quadrant in 2020.* In the first three quarters of 2022, Singapore shed 25.1 percent of its reserves to contain currency depreciation at 6.1 percent. Hong Kong gave up 9.0 percent of its reserves to defend its peg to the US dollar. Korea, the Philippines, and Thailand absorbed double digit rates of currency depreciation while forfeiting 6-7 percent of their reserves. China, Taiwan, and Malaysia also incurred depreciation in this range without pre-emption, and indeed Malaysia leaned into the depreciation.
|
Chart 1. Official Reserves vs Exchange Rate, 2008-2022Q3 Note: Change in reserves is measured as balance of payments flows relative to reserve stocks. Data Sources: IMF International Financial Statistics; and for Taiwan, Central Bank of the Republic of China. |
To be in a position to intervene against depreciation, central banks must build reserves when their currencies are not under duress. This behavior is evident in the bulk of the distribution in Chart 1 lying above the horizontal axis. Reserves of over 100 percent of GDP put Singapore and Hong Kong in comfortable position to intervene at large scale when the need arose in 2022. Most economies in the region are more constrained in their capacity to expend foreign reserves.
The sell-off of reserves in 2022 caused Asian central bank balance sheets to shrink bringing about a monetary tightening. Thus, US tightening induced Asia to follow suit as a consequence of pressure on local currency values. Since inflation had broken out in Asia as well, tightening was warranted. And doing so by leaning against currency depreciation helped to push back on the rising cost of imports.
|
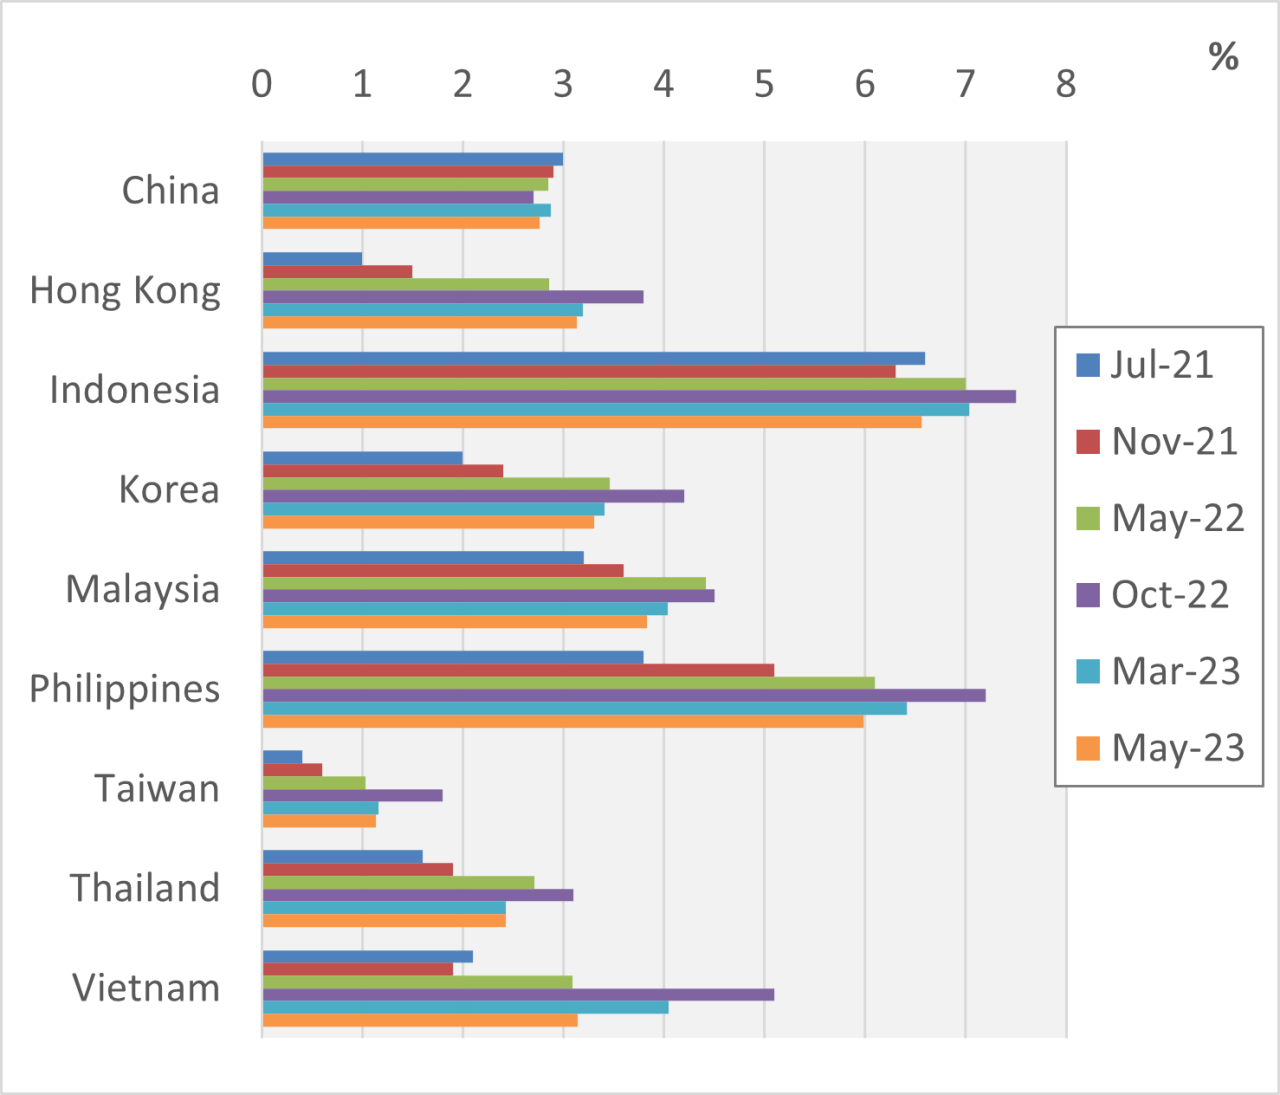
Chart 2. Interest Rate on 10-Year Government Bonds |
On the fiscal policy front as well, 2022 brought pressure to tighten. Fiscal deficits leapt during the pandemic to put debt-to-GDP ratios on an unsustainable course. Spending restraint was made the more difficult by a rising cost of debt service. Chart 2 shows the movement of interest rates on 10-year government bonds. Between July of 2021 and October of 2022, the rate rose by more than 3 percentage points in the Philippines and Vietnam and by more than 2 percentage points in Hong Kong and Korea. By 2023, though, borrowing costs moderated as credit conditions eased. Against the volatility elsewhere in the region, a stable cost of government borrowing in China may be attributed to the country's closed capital markets and government access to reliable sources of domestic funding.
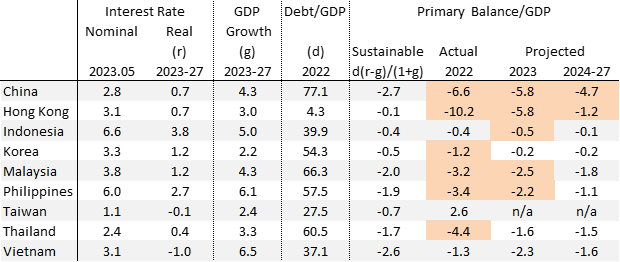
Fiscal sustainability is defined by a stable debt-to-GDP ratio. The condition for achieving this is specified on the primary fiscal balance (the balance net of interest payments) as a function of the interest rate on government debt and the GDP growth rate, as well as the level of debt to GDP. Table 1 presents the sustainability threshold and the values of the determinants by economy based on IMF projections. For 2022, the actual primary deficit exceeded the sustainability threshold for all but Indonesia, Taiwan, and Vietnam. In 2023, Thailand is projected to join these ranks, with Indonesia missing slightly. Over the 2024-27 horizon, all but Hong Kong and China are expected to achieve sustainability. In the Hong Kong case, the existing level of debt to GDP is negligible so the increases at stake for the debt ratio are inconsequential. The China case is more concerning since not only is a debt ratio of 77.1 percent reaching a cautionary zone, but contingent liabilities not accounted for in the budget carry hidden risks. These risks pertain to local government financing vehicles and state-owned enterprises and financial institutions, losses for which may redound to the central government. Even so, there is no definitive standard for an excessive accumulation of debt. Japan is known for a government debt ratio that long ago passed 200 percent of GDP without setting off alarm bells. It's a matter of being able to sustain financing at manageable cost.
|
Table 1: Fiscal Sustainability
Note: The nominal interest rate is on 10-year government bonds; the real rate is based on projected inflation for 2023-2027. Data sources: Nominal interest rates, World Government Bonds; Taiwan primary balance, Ministry of Finance, Republic of China (Taiwan) and author calculations; all else, IMF WEO, April 2023. |
The economies of Emerging East Asia went into the pandemic with sound macroeconomic fundamentals that enabled them to mobilize monetary and fiscal stimulus and return to a solid trajectory. As of 2023, GDP growth projections for the region are good, inflation is being contained, currency values are well managed, and government debt ratios are headed for a sustainable course. So much for the last shock.
*The series of graphs that culminate in Chart 1 (2020, 2021, 2022Q3) are collected in a PowerPoint file that updates Chart 15.4 of Macroeconomics for Emerging East Asia, here.
When you subscribe to the blog, we will send you an e-mail when there are new updates on the site so you wouldn't miss them.
Subscribe via ![]() in the tool bar.
in the tool bar.
Follow us on social media.
![]()
![]()
![]()