China has long gotten a bad rap on currency manipulation. The fact is, however, that China is no different from other East Asian economies when it comes to exchange rate management.
The essence of the East Asian model is to steer the exchange rate along a steady long-run course, erring toward undervaluation in the face of uncertainties about the future. Any perception of overvaluation runs
|
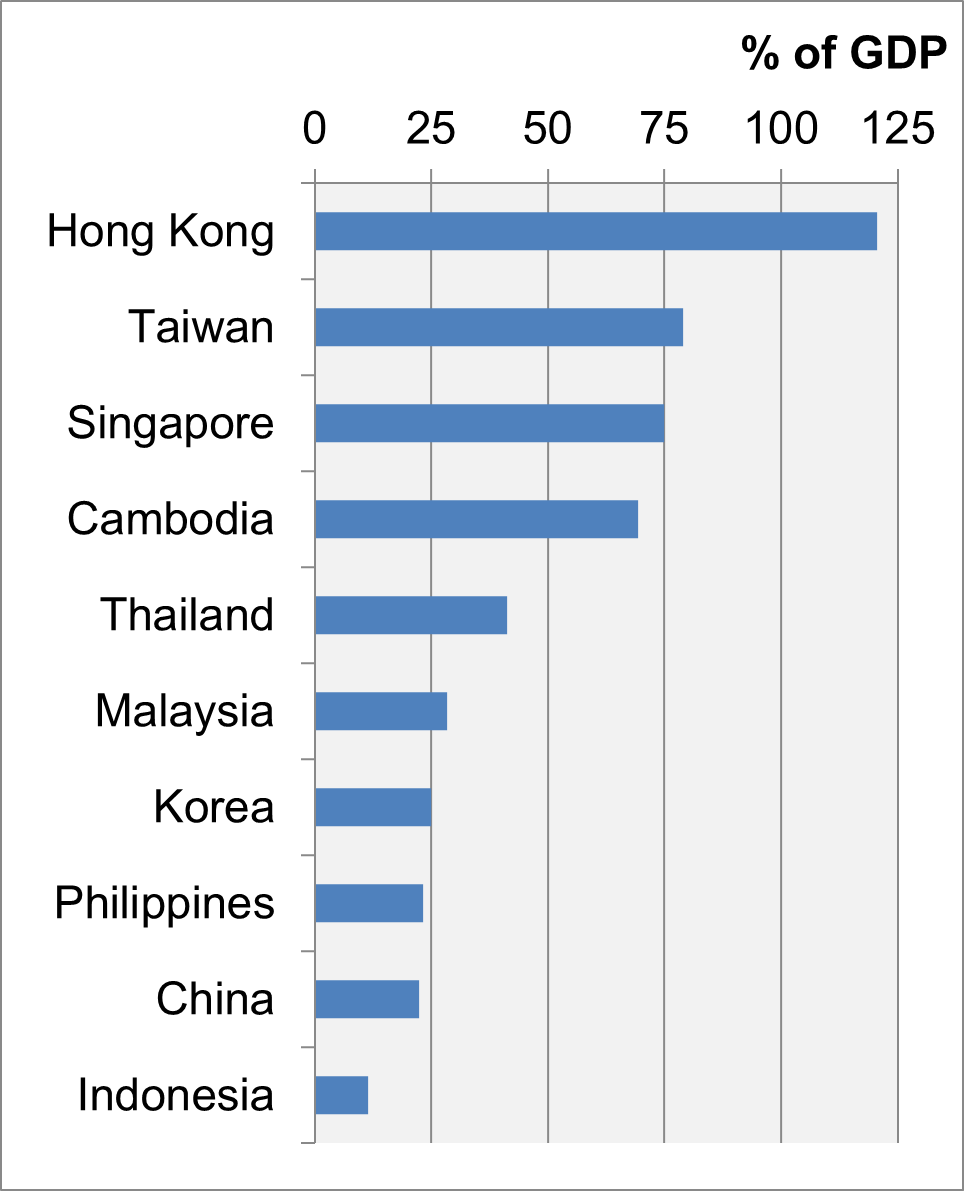
Chart 1: Official Reserves/GDP, 2019
Data Sources: IMF Balance of Payments and International Investment Position Statistics; Central Bank of Taiwan. (Vietnam data are not in the IMF database.) |
the risk of triggering capital outflows and sending the currency into a tailspin. Thus, a corollary of the strategy is for central banks to stockpile sufficient reserves to allay all doubt as to their ability to defend their currencies against a run. That lesson was hammered home by the Asian Financial Crisis.
And the lesson has been taken to heart. As of 2019, official reserves stood at more than 20 percent of GDP for all but Indonesia, as shown in Chart 1. China was next to last with reserves at 22.5 percent of GDP, which nonetheless put the country first in absolute terms at $3.2 trillion. Hong Kong is a special case since under its currency board the monetary base must be fully back by US dollar reserves. Both Taiwan and Singapore hold reserves in the neighborhood of 75 percent of GDP with Cambodia close behind.
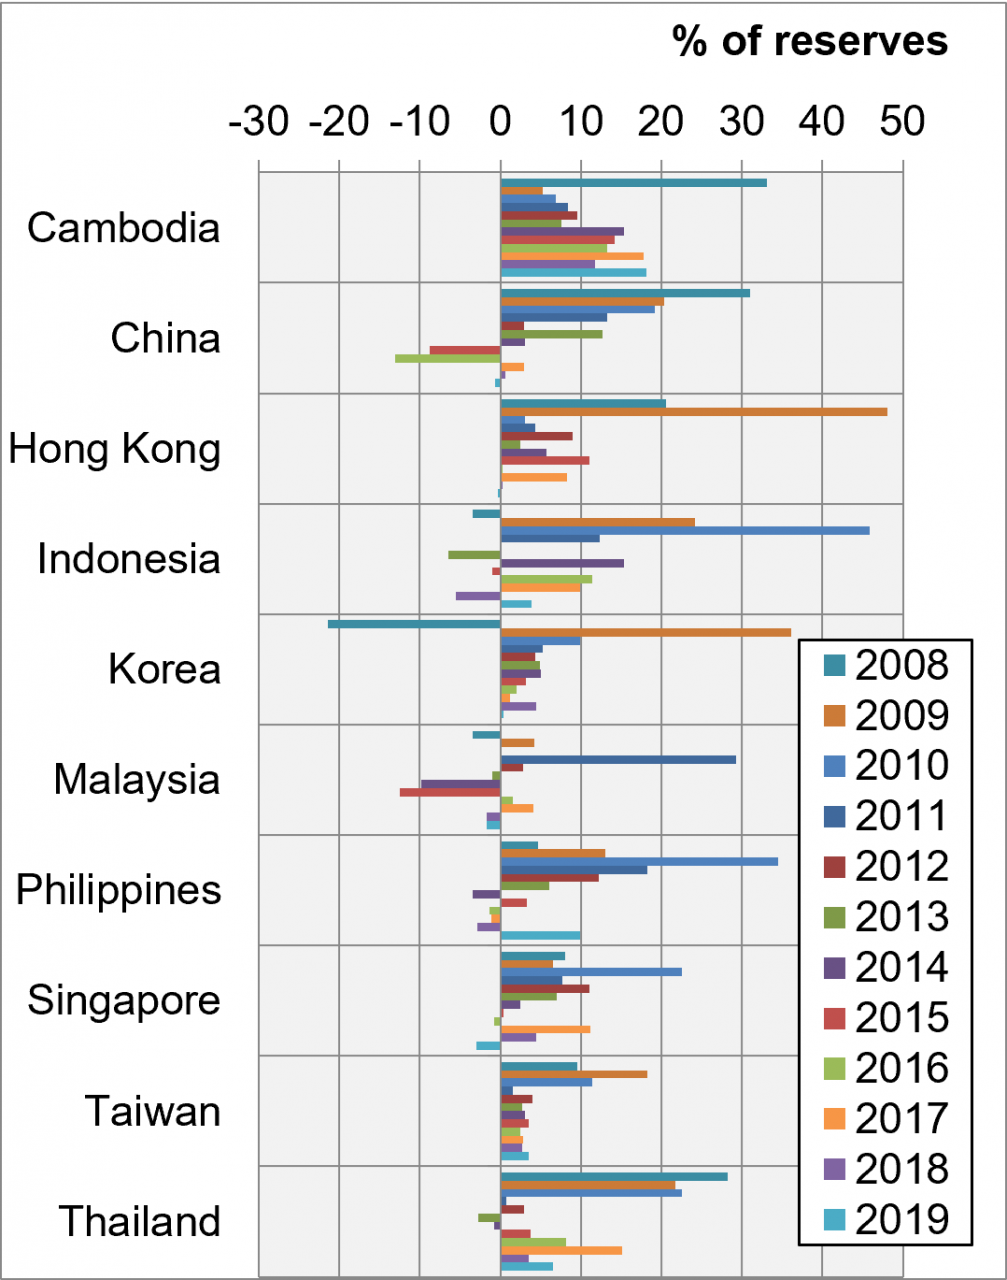
Reserve accumulation is achieved by central banks buying foreign exchange when the local currency is strong and selling only when downward pressure is heavy. Yearly additions and diminutions to reserves through central bank action, as captured by reserve asset flows on the balance of payments, are shown in Chart 2. Clearly the weight lies disproportionately on the addition side. Yet reductions when they do occur can be steep, substantiating the need for preparedness. Changes from year to year are often sharp indicating responsiveness of central banks to turbulent conditions.
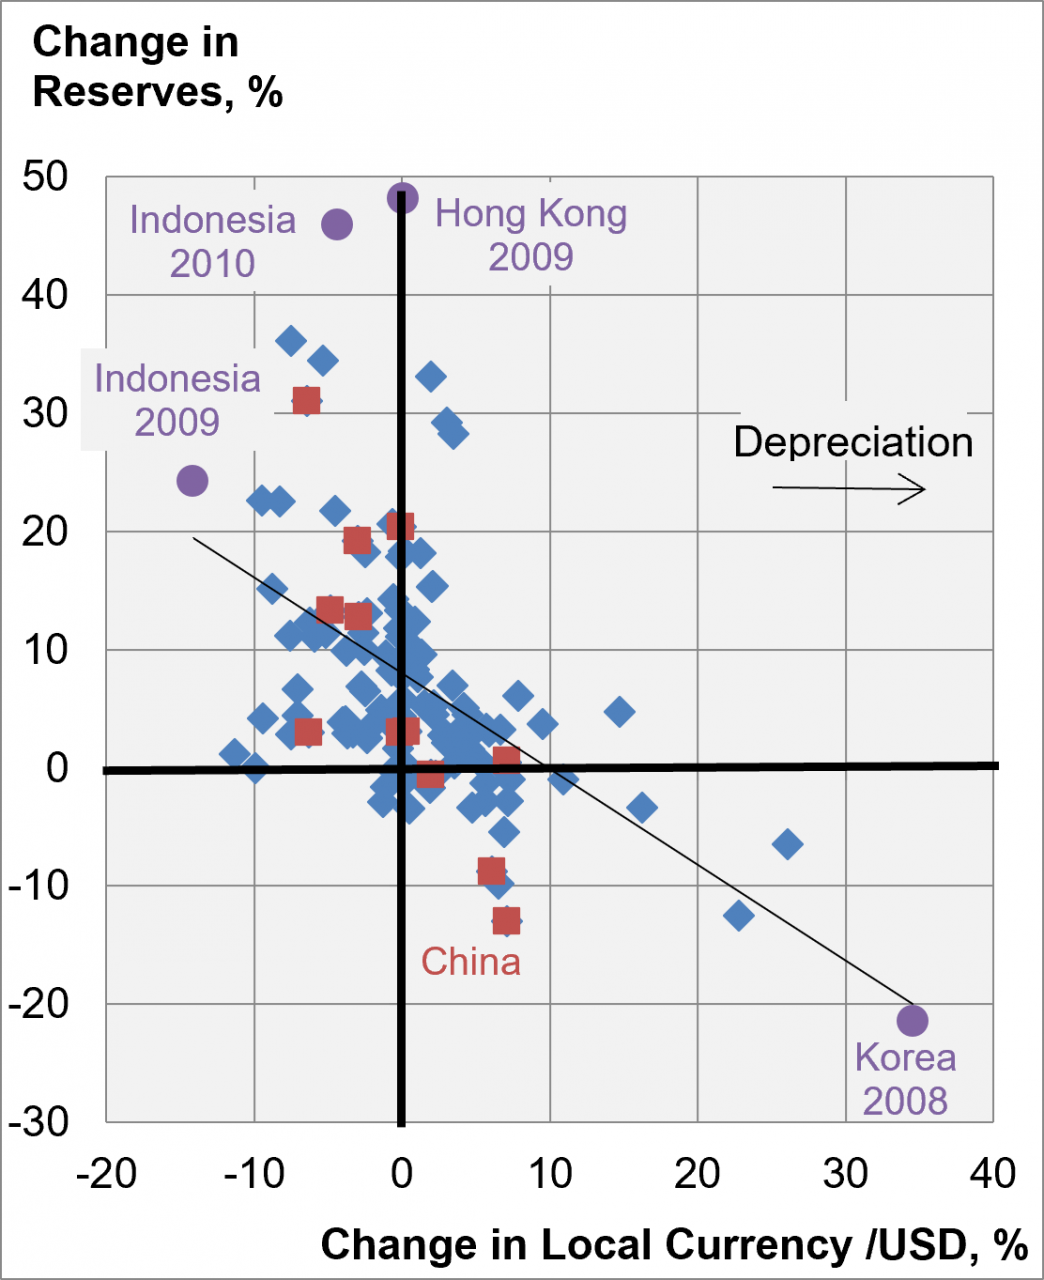
As shown in Chart 3, change in reserves is correlated with change in the exchange rate. When the local currency is appreciating, central banks tend to buy foreign exchange to moderate the rise; when it's depreciating beyond some range of tolerance, they sell. Echoing Chart 2, the bias is decidedly toward buying, with sales meted out more sparingly.
|
Chart 2: Change in Reserves
|
Chart 3: Change in Reserves
|
|
Note: Change in reserves is measured as balance of payments flows relative to reserve stocks. Data sources: IMF Balance of Payments and International Investment Position Statistics; IMF International Financial Statistcs; Central Bank of Taiwan. |
|
Outlier cases are illuminating as to reliance on exchange rate movement versus reserve changes to absorb balance of payments shocks. Hong Kong, with its hard peg to the US dollar, has no leeway in the matter. In 2009, preserving the peg required reserve increases of nearly 50 percent to accommodate massive capital inflows. The inflows were driven by a combination of monetary easing in the US that sent a wave of capital into global markets; mega listings by mainland Chinese companies on the Hong Kong stock exchange; and mainland money pouring into Hong Kong real estate. Had the Hong Kong dollar been allowed to appreciate, the effective higher cost of Hong Kong assets would have mitigated the capital inflows and eased the monetary expansion that amplified asset price increases. Indonesia was an outlier in both 2009 and 2010. As with Hong Kong, capital inflows were part of the story, added to which strong global commodity markets buoyed Indonesia's export revenues. These positive shocks were met in 2009 with an even-handed mix of currency appreciation and reserve accumulation, but by 2010 with the rupiah already up 14 percent, most of the continued pressure was absorbed through reserve increases. A case of negative shocks played out for Korea in 2008 as heightened global risk aversion in connection with the Great Financial Crisis caused capital to flee the highly indebted country while at the same time a contraction in global trade hit its exports. The won depreciated by 34 percent even as the central bank shed more than 20 percent of its reserves to defend it.
In the foregoing cases, and more generally in the pattern of behavior captured in Chart 3, the exchange rate is managed carefully to limit fluctuations while yet allowing for shock absorption to varying degree. How does China, as the much maligned exemplar of currency manipulation, fit into the picture? The same essential strategy is at work. China's exchange rate has tracked within a contained range, the central bank building reserves against appreciation pressure until 2011 to then draw down sharply on them in defense against depreciation in 2015-2016 (Chart 2). During the depreciation interval, China forfeited more than 20 percent of its reserves, an extreme matched only by Korea in 2008 and Malaysia in 2014-2015. Thus, despite reaching a seemingly gargantuan $4 trillion at their peak in 2014, China's reserves proved no more than commensurate with the demands that came to be placed on them. In the aftermath, from 2017 to 2019, both exchange rate and reserve balances stabilized suggesting China had managed a path through the turbulence to achieve long-term equilibrium.
China came under heavy attack for its exchange rate policy through the 2000-aughts as its trade surplus ballooned and reserves piled up. In hindsight, however, the underlying vision seems remarkably prescient. Once-gaping trade surpluses rested on transitory forces. As argued in a previous post (The Real Reason for China's Unbalanced Growth), China's saving rate was driven up sharply by a combination of demographic forces and extraordinarily rapid economic growth that left consumption lagging behind output growth. Saving surged beyond even rather extravagant domestic investment leaving aggregate demand to be bolstered by net exports, which were supported by an exchange rate held fixed against appreciation pressure. In due course, the internal imbalance, and with it the external imbalance, subsided as the saving rate decreased from a peak of 50.7 percent in 2010 to 44.2 percent in 2019 (国家统计局 [National Bureau of Statistics]). The reserves stored up under pressure of Rmb appreciation were put to use when pressure flipped to the depreciation side in 2015-2016. Downward pressure came about as a strengthening dollar relative to other currencies prompted heavy net capital outflows under anticipation that the Rmb would be allowed to depreciate against the dollar. Thwarting expectations, the People's Bank leaned against depreciation, and ultimately as the dollar again weakened, pressure on the exchange rate was relieved.
The monetary authorities of East Asia have developed an effective routine for managing their exchange rates to contend with shocks. In China's case, the overarching shock was a spike in the saving rate which under a stabilized exchange rate manifested for a time as a trade surplus. More generally, economies in the region are buffeted by constant gyrations in global capital flows and changing market conditions for traded goods that they must navigate through.
East Asia's track record makes exchange rate management and the associated accumulation and decumulation of reserves look easy. That it's actually not so easy becomes apparent from a comparison with Latin America, as argued in a sequel post.
__________________
Correction to Chart 3 posted 22 May 2021.
Charts are from Chapter 11 of my textbook in-progress, Macroeconomics for Emerging East Asia (Cambridge University Press, 2022).
When you subscribe to the blog, we will send you an e-mail when there are new updates on the site so you wouldn't miss them.
Subscribe via ![]() in the tool bar.
in the tool bar.
Follow us on social media.
![]()
![]()
![]()