Updated 2 May 2022 to incorporate full year data for 2021.
A previous post analyzing the economics of the pandemic for 2020 documented widely divergent experiences in Asia with respect to case numbers, mobility loss, and export impact, and showed all three of these factors to be systematically related to GDP growth. A follow-up post on fiscal policy found that those economies with ample fiscal space used it to ramp up spending, and a post on monetary policy showed central bank balance sheets expanding under supportive global conditions. In this post, we revisit the analytics using data for 2021.
|
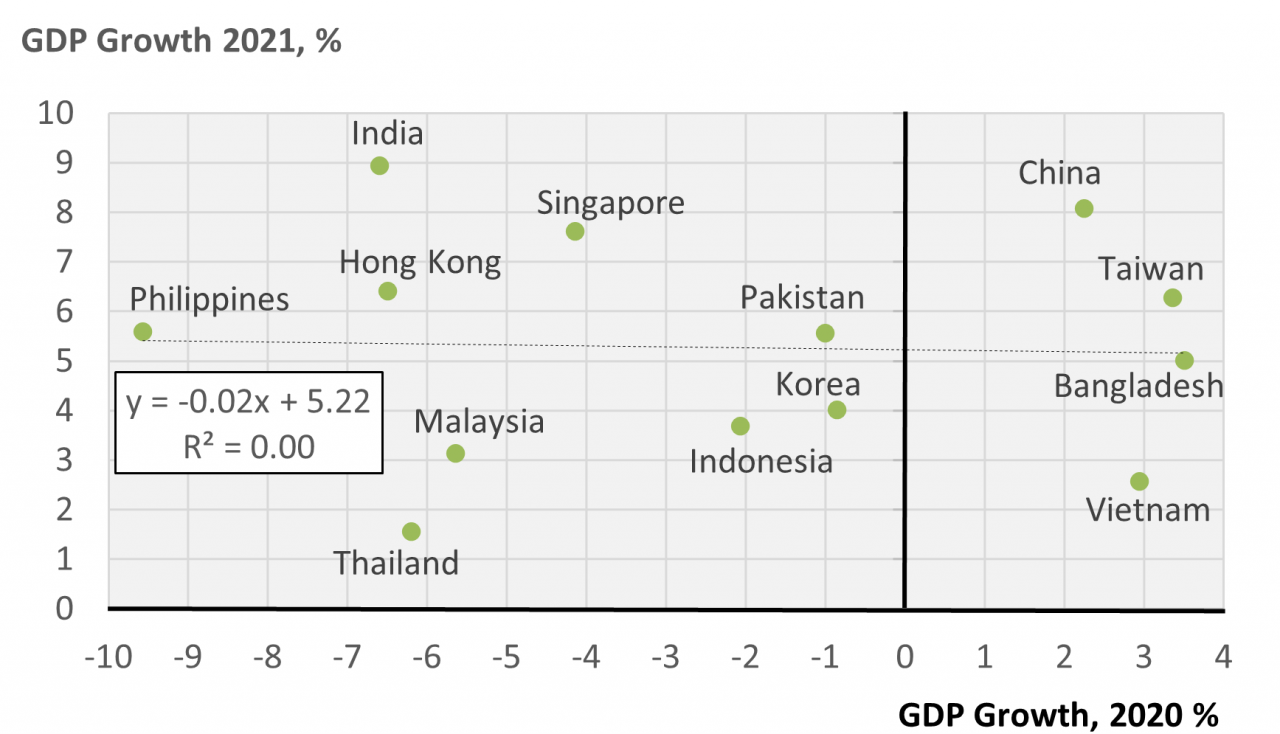
Chart 1: GDP Growth, 2021 vs 2020 Data source: IMF WEO. |
Much changed in the second year of the pandemic. No longer did case numbers, mobility loss, and export performance exhibit any relationship with GDP growth. One might wonder whether this was because base effects dominated for 2021 in the sense that those economies that contracted most sharply in 2020 might have been able to achieve more rapid growth in the following year simply by rebounding from their depths. But this was not the case, as Chart 1 demonstrates. Some economies hit hard in 2020 grew only modestly in 2021 leaving output still well below 2019 levels, Thailand being a case in point. By contrast, India suffered a deep contraction in 2020 yet emerged strongly in 2021. China and Taiwan performed well, given the circumstances, in both 2020 and 2021. The upshot, then, is that the story of GDP growth in 2021 is more complicated than the simple metrics applied to 2020 are able to discern.
A likely reason is that macro policy had time to produce results by year two of the pandemic. As shown in the fiscal policy post for 2020, government spending increases ranged from negligible for Bangladesh and Malaysia to nearly 80 percent for Singapore, with differences in policy response deriving in large part from differences in fiscal space. Table 1 updates the analysis of fiscal space using reported data for 2021 and updated projections for future years. Fiscal space depends on past accumulation of public debt relative to GDP and, insofar as the goal is to sustain an existing debt-to-GDP ratio, on the real interest rate and the GDP growth rate.
Debt-to-GDP ratios for Asia in 2021 ranged from near zero for Hong Kong to 263 percent for Japan. At what level debt loads become problematic depends on many factors. Debt ratios for India at 86.8 percent, Malaysia at 69.0 percent, and Indonesia at 42.8 percent may be more concerning than ratios for Japan at 263 percent and Singapore at 133 percent due to differences in financing costs and potential skittishness of creditors.
|
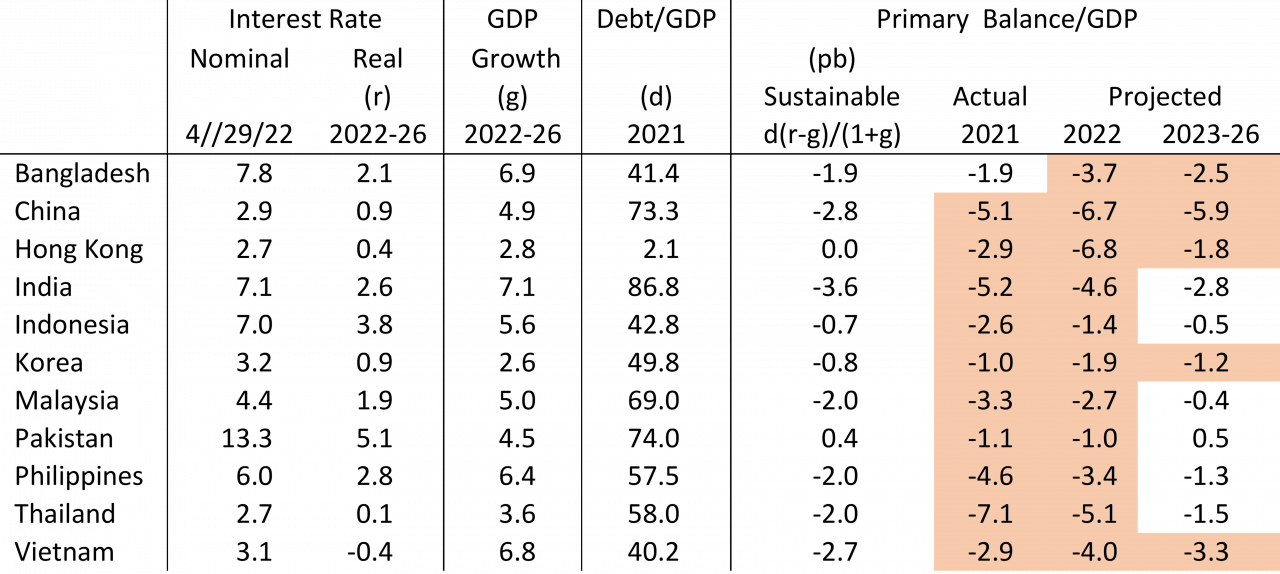
Table 1: Fiscal Space Determinants & Utilization, 2021-2026
The nominal interest rate is on 10-year government bonds. The real rate is based on inflation projections for 2022-2026. Data sources: Nominal interest rates, World Government Bonds; all else, IMF WEO, April 2022. |
Let us set aside the matter of danger thresholds and focus on the effect of the pandemic on increases in debt ratios. The debt-to-GDP ratio (d) will remain constant when the ratio to GDP of the primary balance (which excludes interest payments) is equal to d(r-g)/(1+g), where r is the real interest rate and g is the GDP growth rate. Hence, a lower interest rate and a higher GDP growth rate allow for larger deficits while still preserving a constant debt ratio.
Table 1 shows broad reliance on fiscal stimulus at a cost of rising debt ratios in 2021 and 2022, with a mixed picture beyond that for debt stabilization. Based on IMF projections, China stands out for the heaviest tendency toward exacerbation of an already high debt level. India, Pakistan, and Malaysia also start from high debt levels, but projections are favorable for their return to sustainable paths. Other than China, those that remain on a trajectory of exceeding the sustainability threshold -- Bangladesh, Hong Kong, Korea, and Vietnam -- have low enough existing debt ratios to absorb increases without alarm. Indeed, if there is a moment for exploiting a legacy of fiscal space, the pandemic has presented it.
The sanguine outlook portrayed in Table 1 rests on assumptions of robust GDP growth for 2022-26. Projected growth rates exceed 6 percent for Bangladesh, India, the Philippines, and Vietnam, with Indonesia and Malaysia at 5 percent or more. Weaker growth than projected would push the calculus toward rising debt-to-GDP paths.
So, too, would higher interest rates pose a threat to stabilizing debt ratios. Interest rates on government borrowing are an indicator of how credit markets perceive debt sustainability risks. Real interest rates are highest for Pakistan at 5.1 percent and Indonesia at 3.8 percent. In the rest of the region, governments borrow at less than 3 percent in real terms. However, were inflation to moderate or nominal interest rates to rise, debt service would impose heavier demands on fiscal budgets.
Should growth prove as strong as the IMF forecasts and should borrowing costs remain low in real terms, most of Asia could weather the pandemic in sound fiscal condition having exercised space for stimulus and then returned to a sustainable path.
Fiscal policy space is mainly a legacy of past domestic policy choices. Monetary policy space, by contrast, is subject to the whipsawing of global capital markets caused by US policy. The monetary policy post for 2020 found global conditions supportive of stimulus in view of buoyant exchange rates against central bank acquisition of reserves. In 2021, however, policy space tightened, as shown in Chart 2.
|
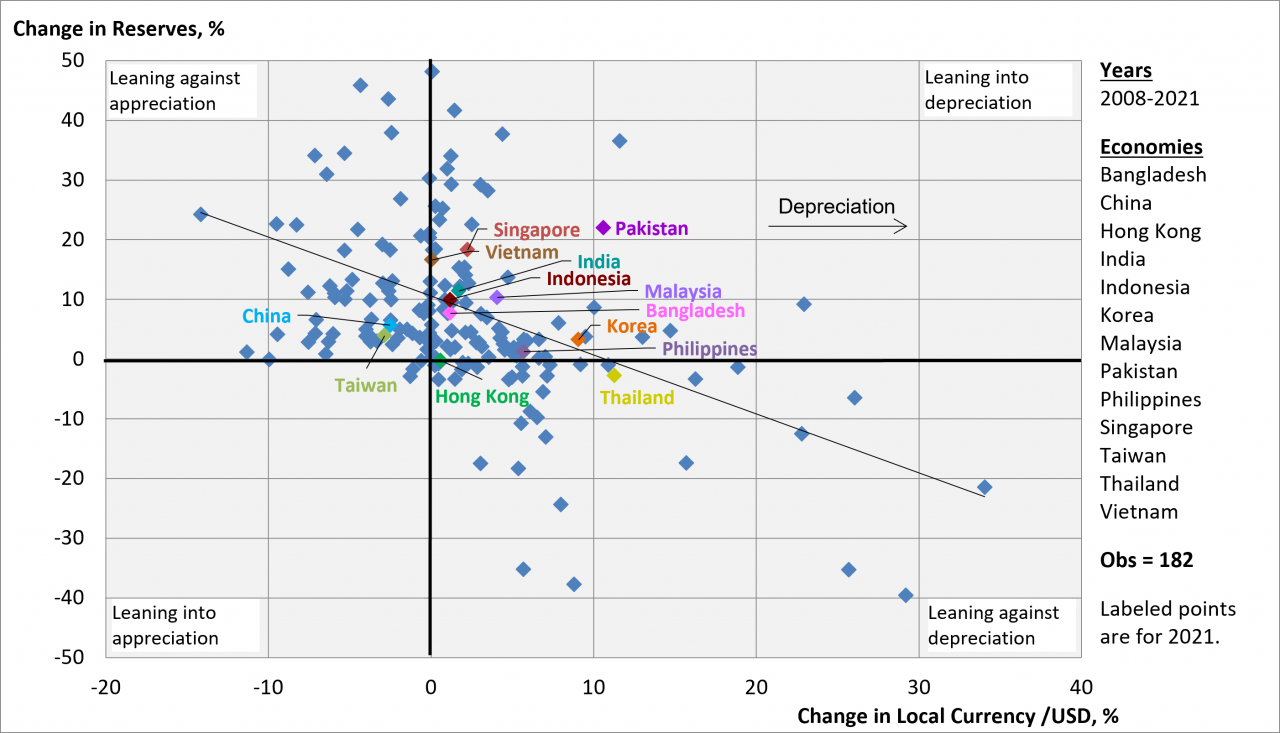
Chart 2: Official Reserves vs Exchange Rate, 2008-2021 Note: Change in reserves is measured as balance of payments flows relative to reserve stocks. Data Sources: IMF International Financial Statistics; and for Taiwan, Central Bank of the Republic of China. |
The vertical axis measures central bank acquisition of reserves (as represented on the balance of payments) relative to reserve stocks. The horizontal axis measures depreciation of the local currency relative to the US dollar. In 2020, all economies under analysis lay above the horizontal axis with most in the upper left quadrant. The upper left quadrant captures central banks leaning against currency appreciation through expansionary buying of foreign exchange against issuance of local currency. In 2021, the preponderance of observations shifted to the upper right quadrant, meaning local currencies were depreciating with central banks leaning into this depreciation by continuing to acquire reserves. Thailand edged into the lower right quadrant as its central bank sold off reserves to moderate currency depreciation. Only China and Taiwan remained in the upper left quadrant, their currencies appreciating with central banks leaning against it. In general then, global capital market conditions became less supportive of Asian economies pursuing monetary stimulus as their currencies depreciated.
Globally, the appeal of investing in Asia is influenced by credit conditions in the US. As the US tightens credit to fight inflation, Asian economies come under pressure to follow suit to keep interest rates competitive. Within the framework of Chart 2, this implies movement toward the lower right quadrant as local currencies come under downward pressure and central banks must lean against this by selling off reserves. For this part of the world then, the timing of a tightening is not a matter of independent choice.
When you subscribe to the blog, we will send you an e-mail when there are new updates on the site so you wouldn't miss them.
Subscribe via ![]() in the tool bar.
in the tool bar.
Follow us on social media.
![]()
![]()
![]()